Rendering Graphviz in your terminal
12 Nov 2022This post was inspired by a Twitter thread by @thingskatedid:
🧵 Make yours and everybody else's lives slightly less terrible by having all your programs print out their internal stuff as pictures; ✨ a thread ✨ pic.twitter.com/NjQ42bXN2E
— Kate (@thingskatedid) April 24, 2021
You should read the whole thread, there are lots of beautiful examples! Her main point is that you should enable your programs to dump their internal state representations visually. Graphviz is a convenient way to do this, since it’s easy to generate and read, and handles the actual rendering for you, but it can feel clunky to repeatedly cycle through the following workflow:
- Make code change
- Run your program (with flags to dump its internal state in Graphviz form)
- Redirect output to a temporary
.dotfile - Remember the right Graphviz incantation to turn the
.dotfile into a.pngor something (dot -T png in.dot >out.png, FWIW, but it took me years to commit that to memory) - Open the resulting
.pngin your graphics viewer of choice
Kate talks about how to shorten this feedback cycle in this thread. This is just my distillation of her suggestions.
I use a terminal called kitty which, among other things, offers the ability to display high-quality graphics inline. The kitty documentation explains how to do it:
kitty +kitten icat path/to/some/image.png
That’s a bit wordy, so I’ve created a shell alias with the same name as Kate’s (idot), like this:
alias idot="dot -T png | kitty +kitten icat"
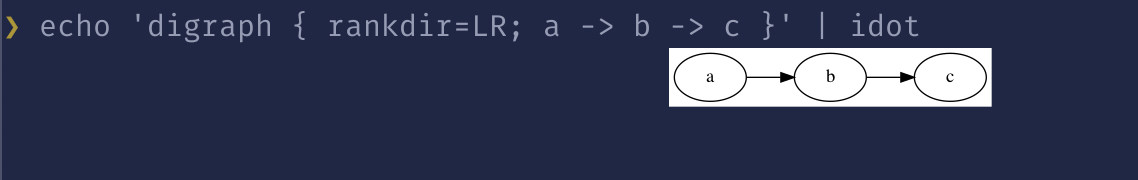
Now I can take some program that emits Graphviz, and just pipe it to idot, like this:
echo 'digraph { rankdir=LR; a -> b -> c }' | idot
Accommodating dark terminal background colors
If you use any terminal background color other than white, you’ll find that by default, your graphs don’t look as nice as Kate’s examples:
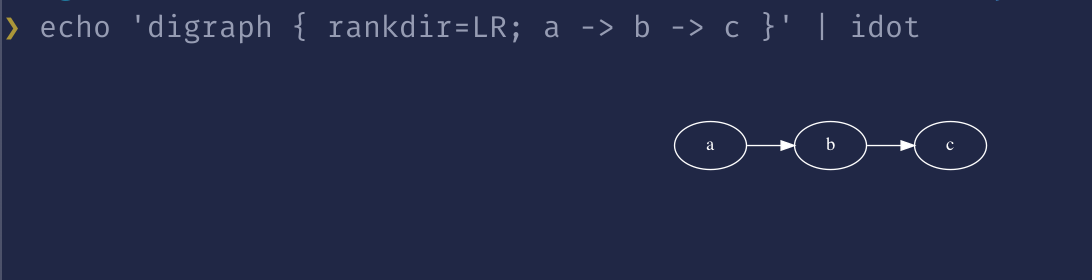
To remove the background colors and make the text, borders, and edges white, you can set a few attributes:
digraph {
  margin=0.75
  bgcolor="#ffffff00"
  color=white
  fontcolor=white
  node [color=white, fontcolor=white]
  edge [color=white]

  // ... the rest of your graph ...
}
If you don’t want to bother with setting these in every chunk of dot you produce, you can modify your idot alias to set them as defaults, using the -G, -N, and -E flags to dot to set default graph, node, and edge attributes on the command line, like this:
alias idot="dot -Gmargin=0.7 '-Gbgcolor=#ffffff00' -Gcolor=white -Gfontcolor=white -Ncolor=white -Nfontcolor=white -Ecolor=white -T png | kitty +kitten icat"
You can also throw whatever other defaults you like into your alias. Check out my previous post about making Graphviz’s output prettier for some ideas.